Common Indicators of Physical Growth
Physical growth is typically represented using measurable indicators that are representative of larger populations. Commonly used physical indicators include weight, height (or length), sitting height (crown-to-rump length), head circumference, chest circumference, arm circumference, and subcutaneous fat.
Patterns of Physical Growth from Birth to Prepubescence
Weight
Weight refers to the total body mass, comprising the aggregate weight of organs, systems, and bodily fluids, with the primary components being bones, muscles, internal organs, fat, and fluids. Among physical growth indicators, weight is the most variable due to fluctuations in fat and fluid levels. Since weight can be measured accurately and readily, it is one of the most accessible indicators for evaluating children's growth and nutritional status. In pediatric clinical practice, weight is often used to calculate medication doses and intravenous fluid volumes.
Neonatal birth weight is influenced by factors such as birth order, gestational age, sex, and intrauterine nutritional status. The World Health Organization (WHO) reference values are 3.3 kg in males and 3.2 kg in females. Postnatal weight gain reflects a continuation of the trajectory established by fetal intrauterine growth patterns.
During the first week of life, insufficient milk intake, fluid loss, and the passing of meconium may cause a temporary decline in weight, referred to as physiological weight loss. This typically reaches its lowest point on the third or fourth day after birth, with a reduction of 3–9%, and starts to recover thereafter. By the 7th to 10th day, weight is expected to return to birth levels. If weight loss exceeds 10% or fails to recover to birth weight by the 10th day, this is considered pathological and warrants investigation. Timely and appropriate feeding practices can mitigate or prevent physiological weight loss in newborns.
Birth weight is significantly influenced by intrauterine factors, while postnatal weight is closely linked to nutrition and illness. As children grow, the rate of weight gain gradually slows. A full-term infant typically gains 1–1.7 kg in the first month after birth, and by 3–4 months, the infant's weight is approximately double their birth weight. During the first year, weight gain in the initial three months is roughly equivalent to the total weight gained during the subsequent nine months, with a typical one-year-old weighing approximately three times their birth weight (around 10 kg). This period represents the first growth peak. During the second year, weight increases by 2.5–3.5 kg. From age two to prepubescence, weight gain slows to about 2 kg per year.
Weight gain is non-linear and uneven, and its assessment should be individualized based on the child's own weight trajectory. "Formulas" or population mean weights (so-called "normal values") should not be treated as standards for evaluation. When direct weight measurements are unavailable, formulas can be used to estimate a child's weight for calculating medication doses and fluid volumes.
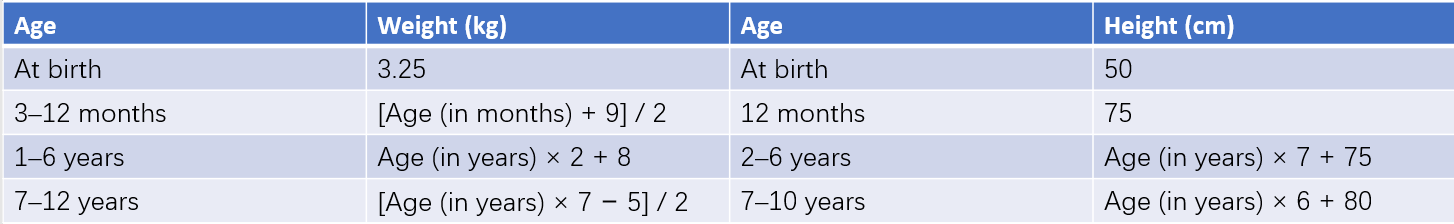
Table 1 Estimation formulas for normal childhood weight and height
Body Length and Height
Height (or Length)
Height refers to the combined length of the head, spine, and lower limbs. For children under three years of age, upright measurements are less accurate, so length is measured in a supine position and referred to as body length. For children over three years, height is measured in an upright position. Upright measurements are typically 1–2 cm less than supine measurements.
The patterns of height (or length) growth are similar to those of weight, with younger children growing faster and experiencing growth peaks during infancy and adolescence. At birth, the average body length is approximately 50 cm. During the first year, growth occurs at the highest rate, with an additional 25 cm. The first three months account for an increase of 11–13 cm, nearly equaling the total increase over the subsequent nine months. By 12 months, body length typically reaches about 75 cm. Growth slows during the second year, with an increase of approximately 10–12 cm, meaning that by age two, body length reaches about 87 cm. After age two, height increases by 6–7 cm annually. Annual growth rates below 5 cm after age two indicate a further deceleration in growth velocity.
Height (or length) is significantly influenced by genetic, endocrine, and intrauterine growth factors. Prolonged malnutrition or chronic illnesses can affect height, though short-term nutritional or health fluctuations generally do not impact growth in height.
Sitting Height (Crown-to-Rump Length)
Sitting height measures the length from the top of the head to the ischial tuberosity. For children under three years old, this is measured in a supine position and referred to as crown-to-rump length. Increases in sitting height reflect the growth of the head and spine.
Arm Span
Arm span measures the distance between the tips of the middle fingers when both arms are fully extended horizontally, representing the growth of the long bones in the upper limbs.
Head Circumference
Head circumference refers to the length encircling the head symmetrically across the supraorbital ridges and occipital protuberance. Its growth is closely related to brain and skull development. During the fetal period, brain development leads all other bodily systems, resulting in a relatively large head circumference at birth, with an average measurement of 33–34 cm. Similar to weight and height growth patterns, during the first year, head circumference grows approximately 6 cm, with the increase over the first three months equal to the growth over the following nine months. By 1 year of age, the average head circumference reaches about 46 cm. Growth slows further in the second year, with an increase of about 2 cm, reaching approximately 48 cm by 2 years of age. Head circumference generally reaches 50 cm by age 5, 53 cm by age 10, and the adult size of around 54 cm by age 15. Measuring head circumference is most valuable during the first two years of life.
Tracking head circumference through consecutive measurements is more critical than relying on a single measurement. Head size is influenced by parental head circumference. A head circumference smaller than the mean minus 2 standard deviations (−2S) often indicates the possibility of delayed brain development, while a measurement smaller than the mean minus 3 standard deviations (−3S) strongly indicates this condition. Excessively rapid growth of head circumference may suggest the presence of hydrocephalus.
Chest Circumference
Chest circumference is measured as the circumference around the chest, passing beneath the nipples and the lower angles of the scapula. It represents the growth of the lungs and thoracic cavity. At birth, the average chest circumference is approximately 32 cm, slightly smaller than the head circumference by 1–2 cm. By around 1 year of age, chest circumference becomes roughly equal to head circumference. After the first year and until pre-puberty, chest circumference is expected to exceed head circumference by about the head circumference plus the child's age minus 1 cm. A crossing point of head circumference and chest circumference curves occurs in growth charts at around the first year of life, with the timing of this crossing linked to the child's nutritional and thoracic development. In children with poor growth, this crossing point may be delayed.
Upper Arm Circumference
Upper arm circumference is measured as the circumference of the arm at the midpoint of the line connecting the acromion (shoulder) and the olecranon (elbow). This measurement reflects the growth of muscles, bones, subcutaneous fat, and skin. During the first year of life, upper arm circumference grows rapidly, but the growth slows between ages 1 and 5, increasing by just 1–2 cm. For children aged 1 to 5 years, upper arm circumference may serve as a screening tool for nutritional status in situations where weight and height cannot be measured. Measurements greater than 13.5 cm indicate good nutrition, 12.5–13.5 cm suggest moderate nutrition, and less than 12.5 cm indicates malnutrition.
Subcutaneous Fat
Subcutaneous fat is assessed by measuring the thickness of skinfolds. Common measurement sites include:
- Abdominal Subcutaneous Fat
- Subcutaneous Fat on the Back
Accurate measurements require the use of skinfold calipers and adherence to standardized methods to obtain reliable data.
Body Proportions and Symmetry
Changes in body proportions and symmetry follow certain patterns during growth.
Head-to-Body Ratio
During the intrauterine and infant stages, the head grows earlier, while the trunk and lower limbs grow later and over an extended period. As a result, the proportion of head to body length changes over time, from 1:4 in newborns to 1:8 in adults.
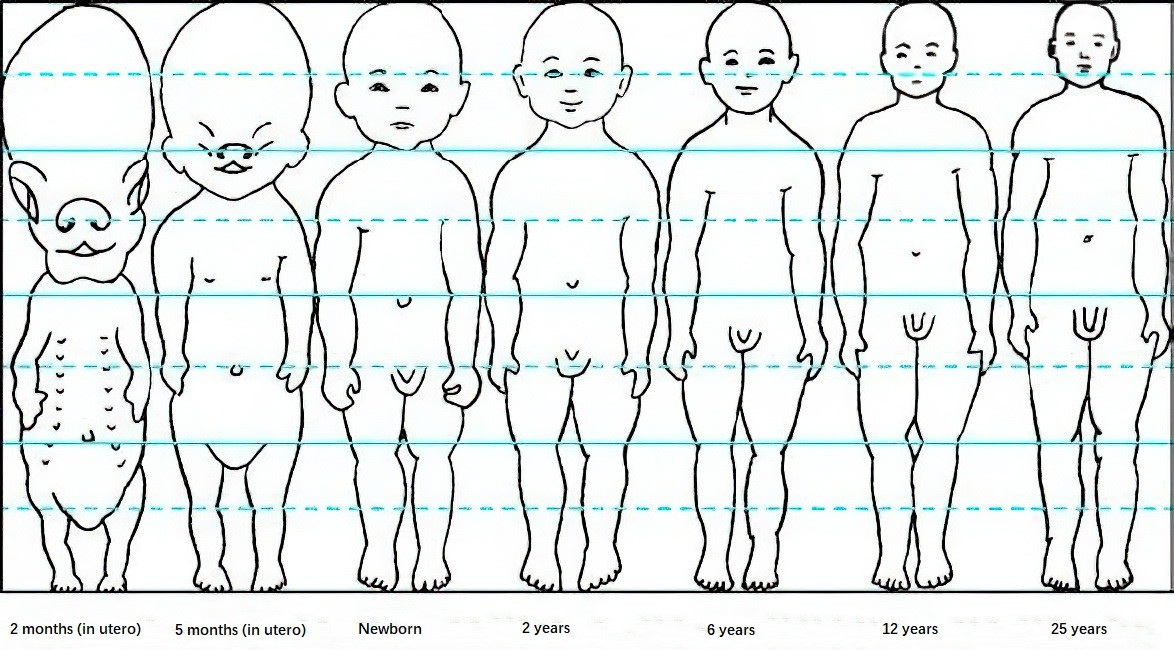
Figure 1 Proportion of head to body length (height)
Body Proportionality
This reflects the ratio relationships in physical growth (morphology). Common indicators include weight-for-height (WFH); chest circumference-to-height ratio (height-chest index); weight (kg) divided by height (cm) × 103 (Quetelet index); weight (kg) divided by [height (cm)]2 × 10⁴ (Kaup index, used for young children); and body mass index (BMI) for age (BMI/age).
Symmetry of Body Structure
Sitting height (crown-to-rump length) as a proportion of standing height reflects the growth of the lower limbs. This proportion decreases from 0.67 at birth to 0.53 by age 14. Any disease affecting lower limb growth may cause the proportion to remain at juvenile levels, as seen in hypothyroidism or achondroplasia.
Arm Span Versus Height
Under normal circumstances, arm span is slightly shorter than height. If the arm span exceeds height by 1–2 cm, it may provide diagnostic value in identifying abnormal long bone growth, such as in arachnodactyly (Marfan syndrome).
Patterns of Physical Growth During Puberty
Puberty, the transitional stage from childhood to adulthood, is marked by the second postnatal peak in growth velocity, referred to as peak height velocity (PHV). This phase is influenced by sex hormones and is characterized by significant gender differences. The height growth spurt in boys occurs approximately two years later than in girls, with boys experiencing a greater annual increase, resulting in higher final adult height compared to girls. Generally, by a bone age of 15 years in boys and 13 years in girls, 95% of their final height is achieved.
During the 1–2 years preceding puberty, growth rates slow down slightly for both sexes. Height growth accelerates in girls after the onset of breast development (around 9–11 years old) and in boys after the enlargement of the testes (around 11–13 years old). Within 1–2 years of acceleration, they reach their respective PHV. During this period, annual height increases average 8–9 cm for girls and 9–10 cm for boys. In the second growth spurt, height increase accounts for about 15% of final adult height. Individuals who enter PHV earlier tend to cease growing earlier.
Weight gain during puberty parallels height growth, accompanied by concurrent increases in the size of internal organs. In females, growth of the pubic and iliac bones, combined with fat deposition, results in an increase in hip circumference. In males, broader shoulders, longer lower limbs, and enhanced muscle growth contribute to distinct body shape differences.
Evaluation of Physical Growth
Children experience rapid growth and development, accompanied by significant changes in body morphology and proportionality. Fully understanding the patterns and characteristics of growth at each stage, accurately assessing growth and development status, identifying problems early, and providing appropriate guidance and intervention are crucial for promoting healthy growth in children.
Principles
Proper evaluation of a child's physical growth involves adherence to several principles:
- Selection of appropriate indicators of physical growth. The most important and commonly used morphological indicators are height and weight. For children under three years old, routine measurement of head circumference is recommended. Other frequently used indicators include sitting height (crown-to-rump length), chest circumference, upper arm circumference, and skinfold thickness.
- Use of accurate measurement tools and standardized measurement methods.
- Selection of appropriate growth standards or reference values. The adoption of the World Health Organization (WHO) 2006 Child Growth Standards is recommended when applicable.
- Regular assessment of growth status, referred to as growth monitoring.
Evaluation Components
The evaluation of children's physical growth includes three main aspects: growth level, growth velocity, and proportionality.
Growth Level
Growth level refers to the position of a child within the population of the same age and sex, as determined by comparing the measured value of a specific growth indicator (obtained through a cross-sectional measurement at a specific age) to growth standards or reference values. Growth level can be evaluated for all individual physical growth indicators, such as weight, height (or length), head circumference, chest circumference, and upper arm circumference.
For preterm infants, there is an acceptable age range for developmental "lag" during growth, after which they are expected to "catch up" with their full-term peers in terms of growth. The evaluation of growth level for preterm infants involves correcting their gestational age to 40 weeks (full term) before assessment. Corrections are applied up to 18 months for head circumference, 24 months for weight, and 40 months for height. After these durations, gestational age corrections are no longer applied.
Growth Velocity
Growth velocity refers to the rate of growth for a specific physical growth indicator, obtained through periodic, continuous measurements (longitudinal observation) of the same indicator. The increase in the indicator value over a certain age period represents the child's growth velocity for that measure. Growth velocity is most effectively represented visually through growth charts, which are simple and intuitive. Regular physical examinations are essential for assessing growth velocity.
This dynamic, longitudinal observation of an individual child's growth trajectory reveals the unique and stable growth pattern for that child, highlighting individual differences. As such, growth velocity provides a more accurate reflection of a child's growth status compared to growth level.
Proportionality
Proportionality is the assessment of the relationships between various physical growth indicators.
Body Proportionality
This refers to the ratio relationships in physical (morphological) growth. Common indicators include weight-for-height (WFH) and body mass index-for-age (BMI/age).
Weight-for-Height (WFH)
This indicator represents the range of weight growth corresponding to a certain height, indirectly reflecting body density and robustness. One key advantage of WFH is that it is independent of age, making it one of the most commonly used indicators for evaluating undernutrition and overweight/obesity in children under two years old.
Body Mass Index (BMI)
BMI is calculated as weight (kg) divided by height squared (m2). It represents the weight per unit area of body surface, reflecting the proportionality of height and weight. Since BMI changes with age in children, age- and sex-specific BMI reference standards are required for interpretation. For children aged two years or older, BMI is considered superior to WFH in assessing overweight and obesity.
Body Structure Proportionality
This is evaluated using the ratio of sitting height (crown-to-rump length) to standing height (or body length), which reflects lower limb growth. Results are compared with reference values for the population, and the assessment is categorized as proportional (symmetrical) or disproportional (asymmetrical).
Statistical Methods for Representing Data
Several statistical methods are commonly used to represent physical growth data:
Mean and Standard Deviation Method
The growth and developmental status of healthy children often follow a normal distribution. The mean and standard deviation (S) method is frequently used, expressed as the mean value ± standard deviation. For example, 68.3% of children’s growth levels fall within the range of the mean ± 1S, 95.4% within the range of the mean ± 2S, and 99.7% within the mean ± 3S. Generally, the range of mean ± 2S (including 95% of the population) is regarded as normal.
Percentile Method
When the measured values exhibit a skewed normal distribution, the percentile method is more accurate for reflecting the distribution of values. When variables follow a normal distribution, the values derived from the percentile method are close to those obtained using the mean and standard deviation method. However, because samples often show a skewed normal distribution, there may be slight differences between the values derived by these two methods. The range of P3 to P97 (including 94% of the population) is often considered normal.
Both methods are widely used in physical growth evaluations, although the percentile method is generally preferred in practice. The mean and standard deviation method is simpler to calculate, while the percentile method is relatively more complex but precise.
Standard Deviation Score (Z-Score) Method
The Z-score method enables comparisons across heterogeneous groups, including differences in sex, age, and indicators. It represents growth status by the degree of deviation from the standard deviation for a given age group, providing precise results. The Z-score is calculated using the formula:
Z = (X − X') / S
where X is the measured value, X' is the mean value, and S is the standard deviation.
The Z-score can take on positive or negative values, with a normal range defined as within ±2 standard deviations.
Median Method
For sample variables following a normal distribution, the median is equal to the mean or the 50th percentile (P50). When the sample’s distribution is not entirely normal, the median is preferred over the arithmetic mean as the central value. This is because instances of extreme variable values may disproportionately affect the arithmetic mean. Using the median is therefore more appropriate for representing the average level of variables in such cases.
Regardless of the statistical method employed, individual differences in children’s physical growth must be considered. The standards for evaluation are designed to be broad, and reference points such as the mean, P50, or median should not be used to judge whether an individual child or a group within a child care institution falls within "normal" ranges. Pursuing "benchmark values" as goals is not advisable.
Application of Growth Curves
Growth curves are one of the most widely used tools in clinical pediatrics for assessing physical growth. Growth curve charts are constructed by plotting measured values on a graph based on either the standard deviation method or the percentile method for various ages and physical growth indicators. Compared to tables, the graphical representation provides a more convenient and intuitive means of not only determining growth levels but also identifying growth trends. Growth curves can also estimate growth velocity and facilitate communication with parents.
Several key aspects are critical for interpreting growth curves:
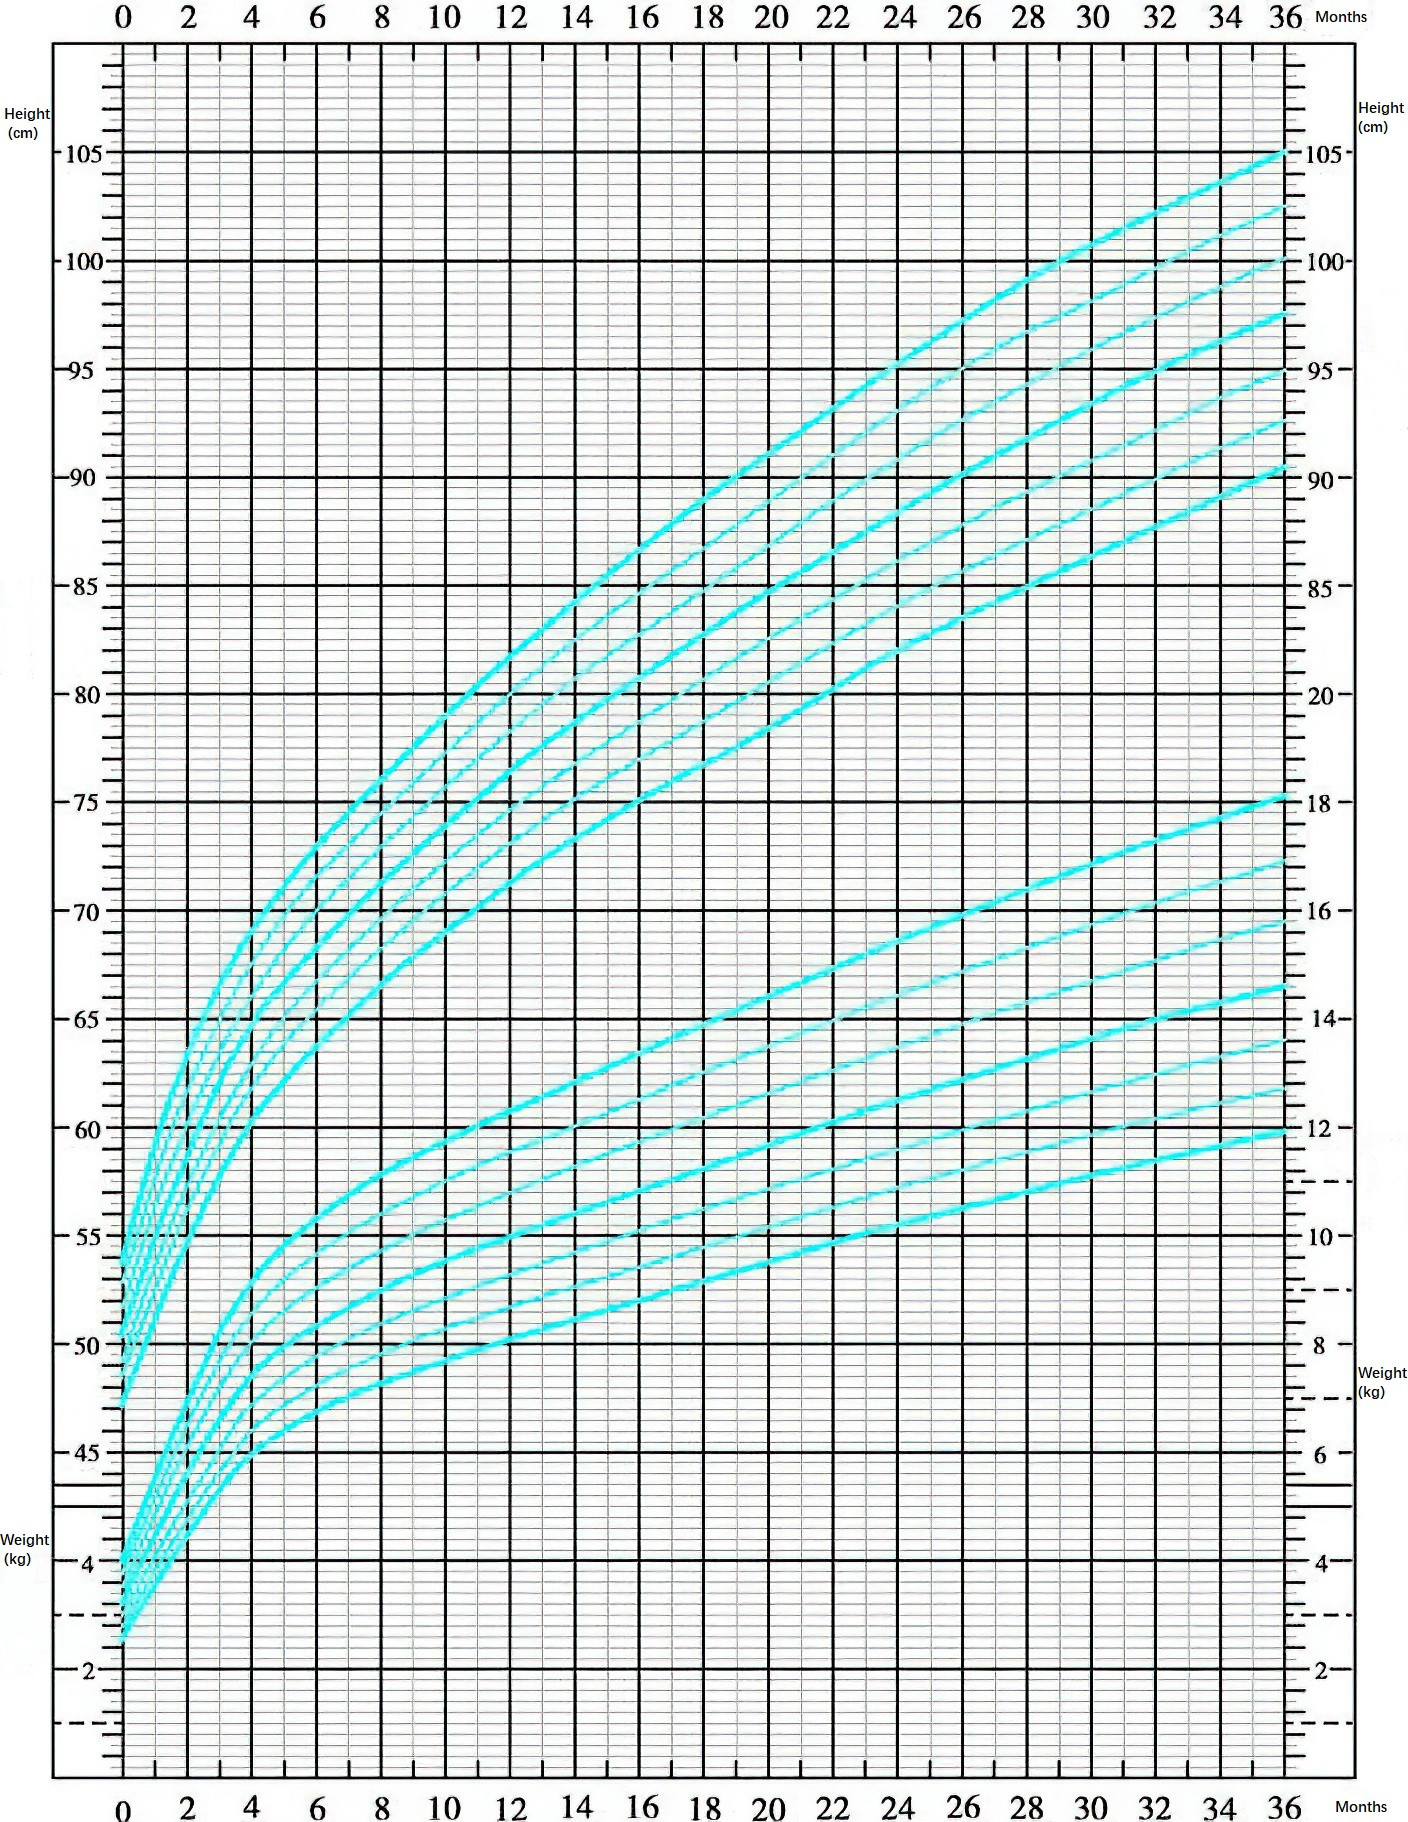
Figure 2 Growth curve chart (male child)
Growth Monitoring
Periodic and consecutive measurements are more valuable than single data points, as they provide individual growth trajectories.
Individual Growth Variability
Physical growth varies among individuals, influenced by genetic and environmental factors. Most children’s weight and height measurements tend to progress steadily along their own growth "trajectory," falling between P3 and P97 (or within the range of mean ± 2S). This variability emphasizes that mean values or P50 are not intended to serve as individual growth targets.
Feeding Practices
Breastfed infants may exhibit slightly slower initial growth compared to formula-fed infants. Growth evaluations for exclusively breastfed infants need to account for feeding methods to avoid unnecessary examinations, excessive use of formula supplementation, or the premature introduction of solid foods.
Regression Toward the Mean
Approximately two-thirds of children's birth weight and length show a tendency to approach the 50th percentile (P50) before the age of 2–3 years. Verification of accurate measurements is necessary beforehand.
Growth Fluctuations
Growth fluctuations occur when serial growth curve measurements deviate from the original, stable growth trajectory by more than one major percentile line. The major percentile lines include P97, P75, P50, P25, and P3, where two adjacent lines correspond to about one standard deviation. Growth fluctuations require an increase in monitoring frequency and investigation into potential causes. Nutritional guidance or feeding adjustments may be necessary.
Growth Abnormalities
Growth abnormalities are identified when growth level or body proportionality values fall below P3 or exceed P97, or when serial growth curve measurements deviate from the original trajectory by more than two major percentile lines. These instances warrant timely evaluation of underlying causes, and if necessary, referral to higher-level medical institutions or specialty clinics for further diagnosis and treatment.