Ophthalmic imaging techniques have advanced rapidly in recent years, and many of these methods have become routine in clinical diagnosis and disease monitoring. This section provides an overview of the principles and indications of several imaging modalities.
Corneal Topography
Corneal topography, also known as computer-assisted corneal topographic analysis, digitizes corneal morphology (e.g., the curvature of the anterior and posterior surfaces of the cornea) using computerized image processing systems. The data is presented as color-coded maps that resemble geographic topography, illustrating the curvature and elevation variations of the corneal surface. Clinically, corneal topography is primarily used to assess irregular astigmatism caused by conditions like keratoconus, to screen for corneal abnormalities before refractive surgery, and to document corneal images before and after refractive surgical procedures.
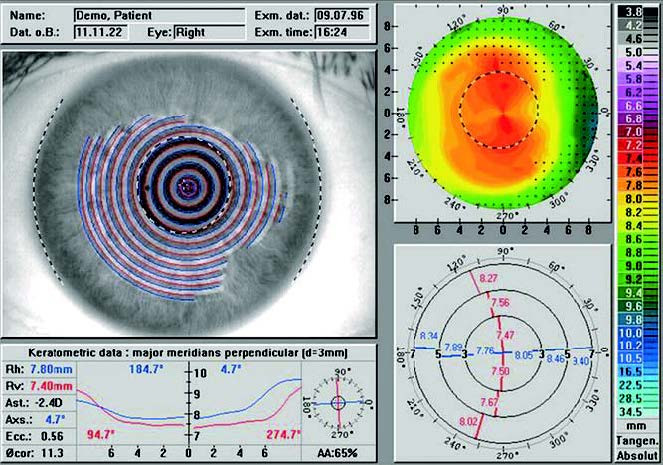
Figure 1 Corneal topography of a normal cornea
Corneal Specular Microscopy
The corneal specular microscope captures images of the endothelial cells on the back surface of the cornea. When light reflects off transparent refractive elements (e.g., cornea, aqueous humor, lens), a reflection occurs at their interfaces. At the interface between the corneal endothelium and aqueous humor, cell borders reflect light to form dark lines, revealing the hexagonal mosaic appearance of corneal endothelial cells. The key parameters include:
Endothelial Cell Density
In healthy individuals:
- Before the age of 30, average endothelial cell density is 3,000–4,000 cells/mm2.
- Around age 50, it decreases to 2,600–2,800 cells/mm2.
- After age 69, it typically measures 2,150–2,400 cells/mm2.
As age increases, cells enlarge and density decreases.
Hexagonal Cell Percentage
Normal corneal endothelial cells are hexagonal and resemble a honeycomb arrangement. A higher proportion of hexagonal cells is preferred, with normal values ranging from 60% to 70%.
Corneal Confocal Microscopy
Corneal confocal microscopy uses confocal laser scanning technology to perform in vivo imaging of the cornea at different layers, elevating corneal examination to the cellular level. Its characteristics of excellent penetration and high resolution produce remarkably clear images, leading to widespread clinical application. It is used for the diagnosis, treatment, and follow-up of fungal keratitis and Acanthamoeba keratitis, the study of corneal morphological changes in dry eye syndrome, the correlation between corneal tissue morphology and visual outcomes following refractive surgery, observation of morphologic features in various corneal dystrophies, and monitoring rejection after corneal transplantation.
Fundus Photography
Fundus photography involves capturing color images of the fundus using a specialized fundus camera. The first clinically applied fundus camera appeared in the 1920s and laid the foundation for the development of fundus imaging technologies, such as fundus fluorescein angiography, and advancements in the understanding of fundus diseases. Fundus photography remains one of the most fundamental and commonly used diagnostic methods for fundus examination. It plays a critical role in diagnosing conditions such as high myopia, diabetic retinopathy, and pediatric retinal diseases. With the increasing use of artificial intelligence in clinical practice, fundus photography has been widely applied to screen for blinding eye diseases like fundus disorders and glaucoma, as well as to facilitate teleconsultation. In addition to conventional fundus cameras, handheld fundus cameras, smartphone-attached fundus cameras, and non-mydriatic fundus cameras have emerged. Furthermore, laser scanning imaging systems can capture wide-field retinal images even under small pupil conditions.
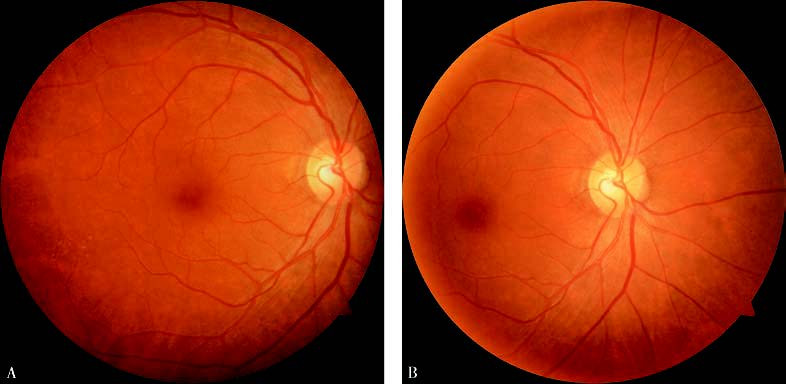
Figure 2 Standard fundus color photograph
(A) Centered on the macular fovea;
(B) Centered on the optic disc.
Fundus Angiography
Fundus angiography involves the intravenous injection of fluorescent dyes (commonly via the antecubital vein) into the body, after which the fundus is illuminated with a specific excitation light source that corresponds to the fluorescent dye used. The emitted fluorescence is captured with appropriate filters to record the morphology and perfusion dynamics of retinal blood vessels. This technique is a key method for assessing the structure and function of retinal blood vessels and their associated tissues.
Fundus angiography is categorized based on the type of fluorescent dye used:
- Fluorescein Angiography (Fundus Fluorescein Angiography, FFA)
- Indocyanine Green Angiography (ICGA)
Fundus Fluorescein Angiography (FFA)
Overview:
Fundus fluorescein angiography (FFA) uses sodium fluorescein as a dye. The molecular weight of sodium fluorescein is 376.3 Da, with 80% of it binding to plasma proteins in the blood. The unbound fraction emits fluorescence at 525–530 nm when excited by blue light (465–490 nm). FFA primarily evaluates abnormalities in retinal vasculature and the retinal pigment epithelium (RPE) barrier. It is one of the most commonly used and fundamental methods for fundus vascular imaging.
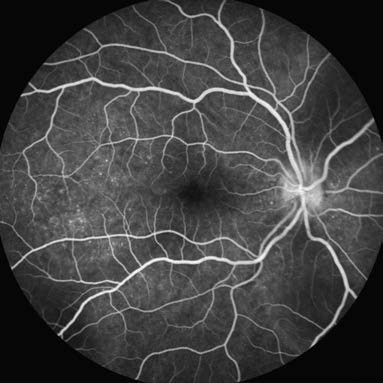
Figure 3 Fundus fluorescein angiography
Angiography Process and Phases
Sodium fluorescein injection may trigger allergic reactions, so a skin test is required beforehand. After the test shows no reaction, 500 mg sodium fluorescein (10%, 5 ml) is administered intravenously, and the timing begins. The FFA process takes approximately 15 minutes and is divided into five phases based on the fluorescence of the central retinal vascular system:
- Pre-arterial phase (early optic disc fluorescence → arterial laminar flow)
- Arterial phase (arterial laminar flow → arterial filling)
- Arteriovenous phase (arterial filling → venous laminar flow)
- Early venous phase (venous laminar flow → venous filling)
- Late phase (5–10 minutes after dye injection)
Image Interpretation
Image analysis focuses on abnormal fluorescence and its dynamic changes. Abnormal fluorescence refers to fluorescence differing from the physiological norm, classified as hyperfluorescence (window defects, vascular abnormalities, and leakage) or hypofluorescence (fluorescence block and vascular filling defects). Dynamic changes involve early hemodynamic patterns and the progression of abnormal fluorescence during different phases of angiography.
Indocyanine Green Angiography (ICGA)
Overview
Indocyanine green angiography uses indocyanine green as the contrast agent. Indocyanine green has a molecular weight of 774.6 Da, with 98% of it binding to proteins in the bloodstream. Unbound dye emits fluorescence at 800–880 nm under near-infrared excitation light (790–800 nm). The excitation and emission spectra of near-infrared light penetrate the retinal pigment epithelium (RPE), macular pigment, and thin layers of hemorrhages, pigments, or lipid exudates, allowing for detailed visualization of choroidal vasculature. Clinically, ICGA is used in the classification of wet age-related macular degeneration (particularly polypoidal choroidal vasculopathy and retinal angiomatous proliferation), the differential diagnosis of central serous chorioretinopathy, the diagnosis of inflammatory chorioretinal diseases, and as an adjunct in diagnosing choroidal tumors.
Angiography Process and Phases
Indocyanine green dye is dissolved at a dose of 0.25–0.5 mg/kg in 2–3 ml of water for injection and administered into the antecubital vein within 5 seconds. Timing begins immediately. The ICGA process lasts approximately 30 minutes and is typically divided into three phases based on timing:
- Early phase (within 5 minutes)
- Mid-phase (5–20 minutes)
- Late phase (after 20 minutes)
This procedure is contraindicated for individuals allergic to iodine or shellfish. Currently, FFA and ICGA can be performed simultaneously.
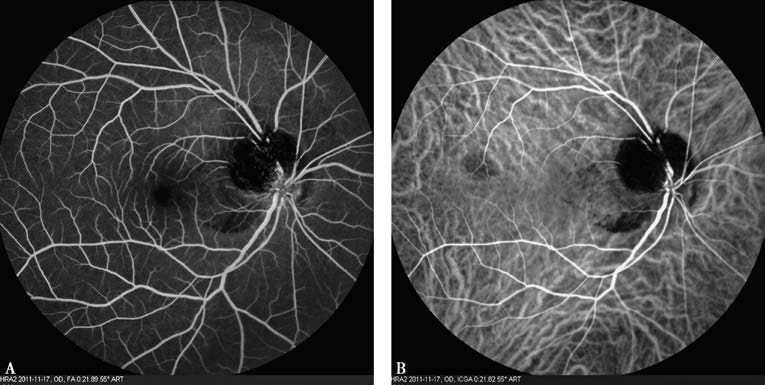
Figure 4 Simultaneous FFA (A) and ICGA (B)
ICGA Fluorescence Interpretation
Persistent hyperfluorescence indicates choroidal neovascularization or dye leakage.
Persistent hypofluorescence is caused by:
- Fluorescence blockage.
- Delayed or absent vascular perfusion.
- Choroidal capillary atrophy.
Fundus Autofluorescence Imaging
Fundus autofluorescence imaging is a novel non-invasive fundus imaging technology that creates images based on the fluorescent properties of lipofuscin. Lipofuscin, a byproduct of photoreceptor metabolism, fluoresces or emits light under blue light excitation. This light appears white and occurs naturally, hence the name “autofluorescence.” Fundus autofluorescence can be detected using devices such as confocal scanning laser ophthalmoscopes. Abnormal autofluorescence refers to deviations from normal findings, manifesting as either hyperautofluorescence (white/bright areas) or hypoautofluorescence (black/dark areas).
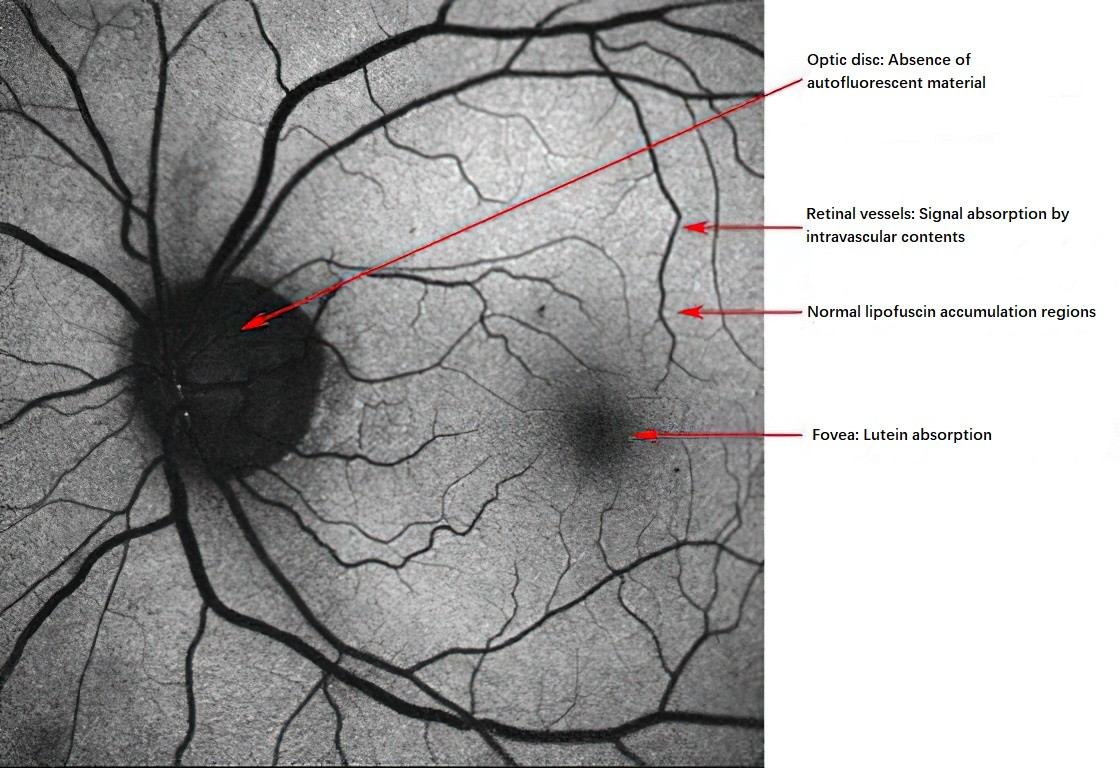
Figure 5 Spontaneous autofluorescence of a normal fundus
Causes of Increased Autofluorescence (Hyperautofluorescence):
- Subretinal accumulation of lipofuscin.
- Excessive lipofuscin buildup within retinal pigment epithelial (RPE) cells.
- RPE proliferation.
- Reduced macular pigment or reduced occlusive effects of macular tissue cavity formation on autofluorescence.
- Optic disc drusen.
Causes of Decreased Autofluorescence (Hypoautofluorescence):
- Decreased lipofuscin density within RPE cells.
- Increased melanin within RPE cells.
- Occlusive effects anterior to RPE cells.
Optical Coherence Tomography
Optical coherence tomography (OCT) is a non-contact, non-invasive mainstream optical imaging diagnostic technology. OCT employs low-coherence interferometry to generate cross-sectional images of transparent and semi-transparent tissues within the eye by analyzing the differences in time delay and intensity of reflected light from these tissues. OCT is characterized by its non-invasive nature, high resolution, excellent repeatability, and fast image acquisition. It includes both anterior and posterior segment imaging.
Anterior segment OCT provides clear visualization of anterior chamber structures, such as the iris root, angle recess, ciliary body anterior surface, scleral spur, trabecular meshwork, and Schlemm's canal. It allows for precise and repeatable measurements of corneal thickness and other anterior chamber parameters. Posterior segment OCT is of significant value in diagnosing various fundus diseases, such as edema, holes, epiretinal membranes, retinoschisis, neuroepithelial and pigment epithelial detachment, vitreoretinal traction, and choroidal neovascularization. It can also perform quantitative measurements of retinal nerve fiber layer thickness and facilitate glaucoma follow-up. As advancements in resolution and scanning depth continue, OCT can also accurately depict fine photoreceptor light band structures and choroidal thickness.
Optical Coherence Tomography Angiography
Optical coherence tomography angiography (OCTA) is a vascular imaging technique developed from OCT. It detects blood flow signals based on changes in OCT signals caused by the motion of particles, such as red blood cells, in blood vessels. By analyzing these changes and reconstructing three-dimensional images, OCTA visualizes the vascular structures of the retina and choroid. OCTA does not require dye injection and has the advantages of being non-invasive, offering 3D imaging, and achieving high resolution. It has rapidly found clinical and research applications in fundus diseases, including diabetic retinopathy, retinal vein occlusion, retinal artery occlusion, and age-related macular degeneration. In addition, OCTA can scan anterior segment structures and provide valuable imaging information for anterior segment diseases such as glaucoma and cataracts.
Ocular Ultrasound Examination
Ocular ultrasound examinations include A-scan, B-scan, ultrasound biomicroscopy (UBM), and color Doppler imaging (CDI).
A-Scan Ultrasonography
A-scan ultrasound uses a frequency range of 8–12 MHz to display echo signals (reflected curves) from each acoustic interface in the examined tissues. These echoes are represented as peaks arranged sequentially along a baseline according to the time they return to the probe, forming a one-dimensional image aligned with the direction of the probe. A-scan ultrasound offers highly accurate distance measurements and quantification of echo intensity. It is commonly used to measure axial length, particularly in cases of significantly opacified ocular media, aiding calculations of intraocular lens power during cataract surgery and assisting in the auxiliary diagnosis of conditions like congenital microphthalmia and congenital glaucoma. It also characterizes echoes from intraocular or orbital tissues. Specialized A-scan techniques can measure corneal thickness.
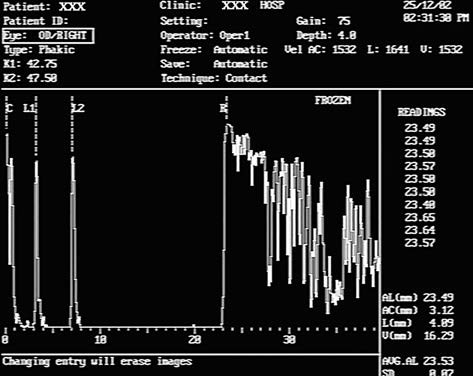
Figure 6 A-scan ultrasound of a normal eye
C: Corneal spike;
L1: Anterior lens capsule spike;
L2: Posterior lens capsule spike;
R: Retinal spike.
B-Scan Ultrasonography
B-scan ultrasound uses either sector or linear array scanning to display the reflected echoes as light dots of varying intensity and size. These dots form a two-dimensional sonographic image comprised of countless echo-generated light points. The brightness of the dots corresponds to echo intensity. On an oscilloscope screen, these dots are arranged to create a real-time, 2D tomographic image spanning from the iris to the posterior segment. Real-time dynamic scanning provides a clear impression of a lesion's location, size, shape, and relationship to surrounding structures. This method is used to evaluate posterior segment anatomy when ocular media is notably opacified, such as in cases of posterior scleral rupture, intraocular foreign bodies (location and characteristics), assessment of intraocular tumors, extent and severity of retinal or choroidal detachments, and differential diagnosis of similar conditions.
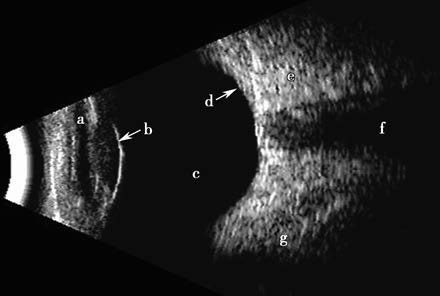
Figure 7 B-scan ultrasound of a normal eye
(a) Anterior chamber;
(b) Lens-vitreous interface echo;
(c) Echoless vitreous cavity;
(d) Echo from the ocular wall;
(e) High echo intensity from retrobulbar fat;
(f) Echoless zone of the optic nerve;
(g) Low echo-intensity band of the extraocular muscles.
Ultrasound Biomicroscopy (UBM)
UBM is a specialized type of B-scan ultrasound with transducers operating at frequencies exceeding 40 MHz, enabling highly detailed 2D imaging of tissue structures with resolution comparable to that of low-magnification optical microscopy. Due to its limited penetration depth (scanning depth of approximately 5–8 mm), UBM is suitable for examining anterior segment structures. It is the only method capable of observing the posterior chamber, lens zonules, and ciliary body in a living eye. Applications include:
- Objective assessment of panoramic anterior segment architecture, including the anterior chamber angle and adjacent structures.
- Evaluation of anterior segment trauma, such as the extent and degree of ciliary body detachment, lens dislocation, or small anterior segment foreign bodies.
- Observation of anterior segment tumors' morphology.
- Diagnosis of ciliary body, peripheral vitreous, and peripheral retinal diseases.
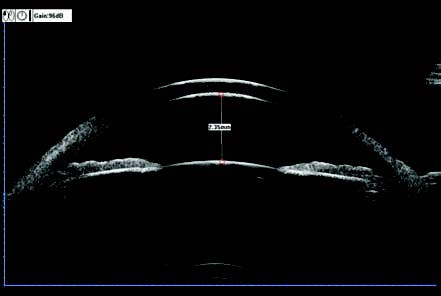
Figure 8 Panoramic anterior segment UBM image

Figure 9 UBM image of the anterior chamber angle and surrounding structures
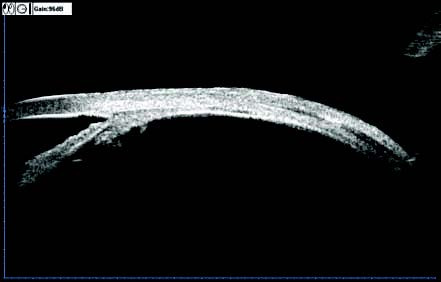
Figure 10 UBM image of the vitreous base and peripheral retina
The procedure involves using a water bath cup or water bag in contact with the eye. It is contraindicated in cases of fresh globe rupture injuries.
Color Doppler Imaging (CDI)
CDI uses the Doppler effect, which occurs when relative motion exists between the ultrasound probe and the targeted interface, to display blood flow characteristics in real-time. These characteristics are superimposed as color-coded signals on a 2D grayscale B-scan image. Blood flowing towards the probe (usually arteries) is displayed in red, whereas blood flowing away from the probe (typically veins) appears blue. CDI provides localized, sampled, and quantitative analysis of blood flow. It can evaluate orbital vessels, intraocular and orbital tumors, and conditions such as:
- Superior ophthalmic vein diseases, such as cavernous sinus fistulas or thrombosis.
- Orbital varices or arteriovenous malformations.
- Retinal central artery and central vein occlusions.
- Ocular ischemic syndrome (detecting changes in the ophthalmic artery).
- Giant cell arteritis (examining the temporal artery).
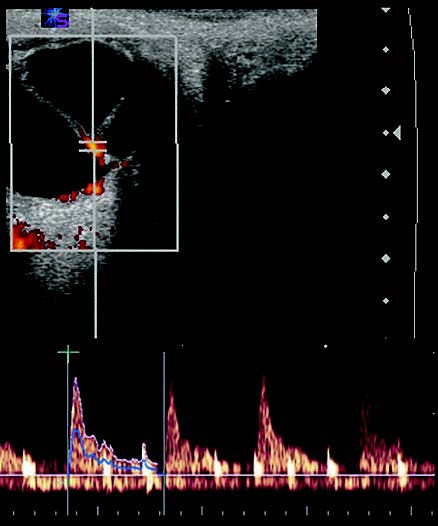
Figure 11 CDI image and spectrogram of a patient with retinal detachment
Computerized Tomography
Computerized tomography (CT) integrates electronic computing with conventional X-ray tomography to produce two-dimensional cross-sectional images. CT imaging can include transverse (axial or horizontal) planes, coronal planes, three-dimensional reconstructions, and scans utilizing iodine-based contrast agents. The density resolution of CT is superior to standard X-ray imaging, allowing for excellent visualization of bony structures. It provides diagnostic imaging of soft tissues, bones, and vessels simultaneously, offering detailed soft tissue images, particularly when combined with intravenous contrast agents. CT scans are faster than magnetic resonance imaging (MRI), have higher spatial resolution, and are less affected by motion artifacts. Indications for CT scanning include abnormal globe position, intraocular masses, intraorbital lesions, abnormalities or absence of extraocular muscles, ocular trauma, bony and soft tissue injuries, lesions at the interface of the skull or sinuses with the orbit, orbital manifestations of systemic diseases, orbital syndromes, and congenital orbital abnormalities.
Magnetic Resonance Imaging
Magnetic resonance imaging (MRI) is a diagnostic technique based on the principle that atomic nuclei with magnetic moments can undergo energy level transitions when subjected to a magnetic field. Compared to CT, MRI offers a greater variety of imaging parameters, higher soft tissue resolution, and more detailed visualization of soft tissue structures. It can distinguish subtle differences between various soft tissue types and avoids the ionizing radiation exposure associated with X-rays. However, dense tissues with low hydrogen content, such as compact bone, calcifications, or gas-filled structures, cannot be imaged using MRI.
Except for cases involving magnetic foreign bodies, MRI is indicated for a wide range of ocular and orbital conditions requiring imaging, including:
- Diagnosis and differential diagnosis of intraocular tumors.
- Orbital tumors, especially small lesions located in the orbital apex or optic nerve tumors, as well as detection of tumor invasion into the optic canal or the cranial segment, where MRI is superior to CT.
- Acute and chronic orbital inflammations.
- Vascular lesions within the orbit.
- Orbital trauma.
- Tumor invasion from orbital lesions into the cranial cavity or from periorbital tumors into the orbit.
- Certain neuro-ophthalmologic disorders.