Common clinical visual electrophysiological exams include the electroretinogram (ERG), visual evoked potential (VEP), and electrooculogram (EOG). The relationship between different visual electrophysiological tests, their detected waveforms, and the corresponding visual structures is summarized as follows.
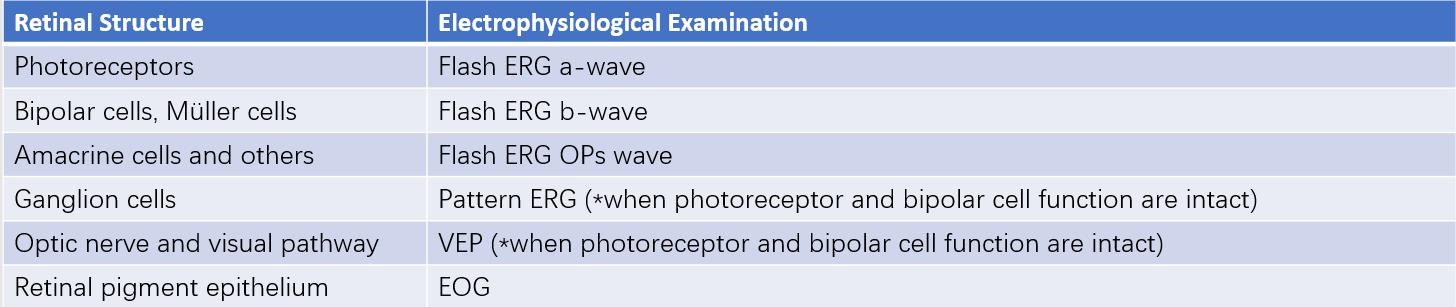
Table 1 Retinal structures and corresponding electrophysiological examinations
Electroretinogram (ERG)
The ERG records a series of retinal potential waveforms using electrodes placed on the cornea in response to flash or pattern stimuli to the retina. It represents the summed electrical responses of various retinal layers, from photoreceptors to cells in the inner nuclear layer, and is useful in the diagnosis of retinal diseases.
Flash ERG
This test typically includes five components:
- Rod Response: Recorded in a dark-adapted state using low-intensity white light stimulation, it produces a positive wave with a longer latency.
- Dark-Adapted Maximal Response: Recorded under dark-adapted conditions with standardized white light stimulation, it generates a biphasic waveform, comprising a negative a-wave (originating from photoreceptors) and a positive b-wave (dominated by inner retinal bipolar cells).
- Oscillatory Potentials (OPs): Detected by widening the frequency band of the recording device. Under dark-adapted conditions with white light stimulation, 4–5 small oscillatory subwaves appear on the ascending limb of the b-wave.
- Cone Response: Measured after 10 minutes of light adaptation, the a- and b-wave amplitudes elicited by white flash stimulation are significantly lower than those of the dark-adapted maximal response.
- Flicker Response: Recorded in light-adapted conditions with 30 Hz white flicker light stimulation, this response reflects cone function and exhibits a sinusoidal waveform.
The clinical significance of changes in these waves includes:
- Decreased a- and b-wave amplitudes indicating dysfunction in both inner and outer retinal layers, observed in conditions such as retinitis pigmentosa, vitreous hemorrhage, chorioretinitis, panretinal photocoagulation effects, retinal detachment, siderosis, chalcosis, or drug toxicity.
- Normal a-wave amplitude but decreased b-wave amplitude suggesting inner retinal dysfunction, seen in congenital stationary night blindness type II, Oguchi disease (which shows prolonged dark adaptation with b-wave recovery), X-linked juvenile retinoschisis, and central retinal artery or vein occlusion.
- Abnormal cone response with normal rod response observed in total color blindness or progressive cone dystrophy.
- Reduced or absent OP amplitudes associated with ischemic retinal conditions, such as diabetic retinopathy, ischemic central retinal vein occlusion, and retinal periphlebitis.
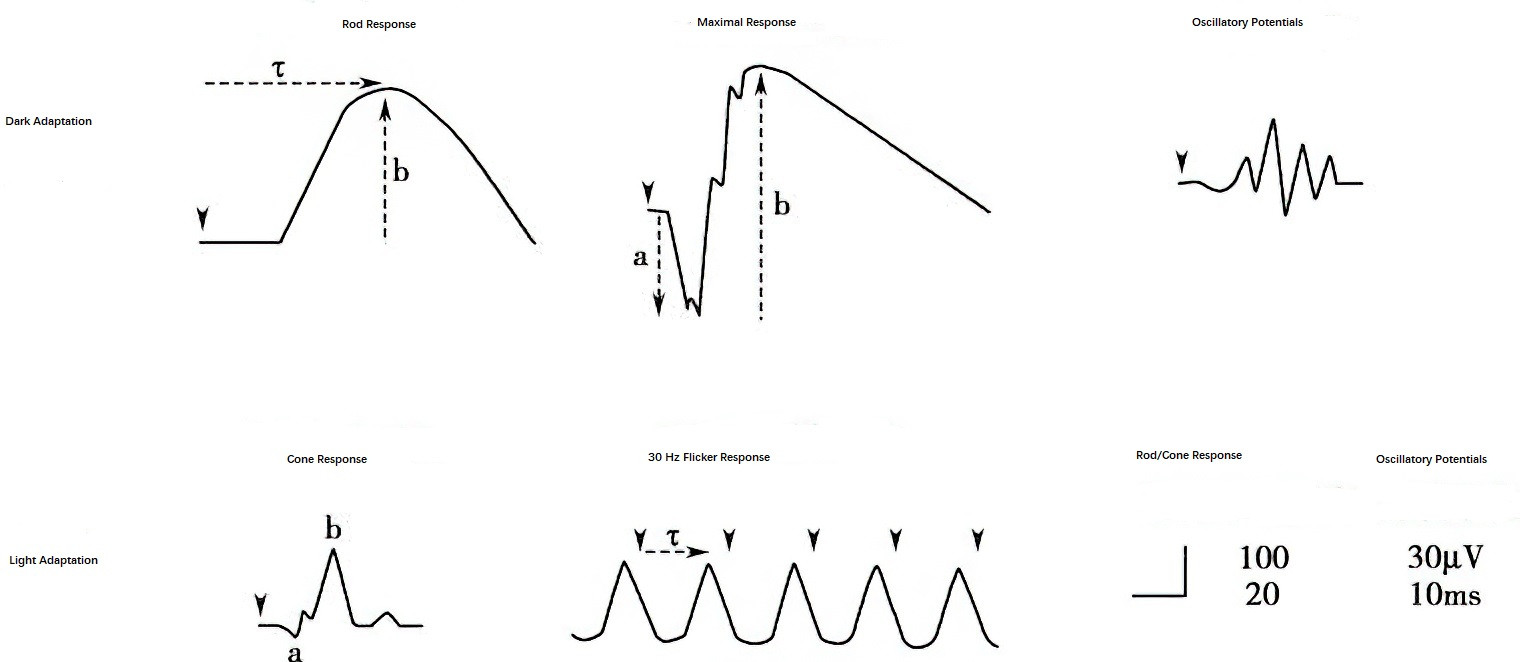
Figure 1 Schematic diagram of the five responses of flash electroretinogram
Pattern ERG (pERG)
Composed mainly of the positive P1 (P-50) wave and the subsequent negative N1 (N-95) wave, pattern ERG is closely related to retinal ganglion cell activity. While the positive wave also reflects contributions from other retinal structures, pattern ERG assists in the diagnosis of conditions such as primary open-angle glaucoma (where changes in pattern ERG precede those in VEP) and macular disorders.
Multifocal ERG (mfERG)
This test extracts localized ERG signals from multiple retinal regions using a computer-controlled stimulator, with the results analyzed and displayed as a grid of responses or a 3D topographical map. It reflects the local function of the posterior pole retina (within 25° of the visual field) and is particularly useful in diagnosing macular diseases.
Visual Evoked Potential (VEP)
The VEP reflects visual information transmission beyond the third-order neuron (ganglion cells), primarily testing the integrity of neural pathways from the retina to the visual cortex. It evaluates the health of the optic nerve fibers and cortical visual function, as any lesion affecting these fibers can lead to VEP abnormalities.
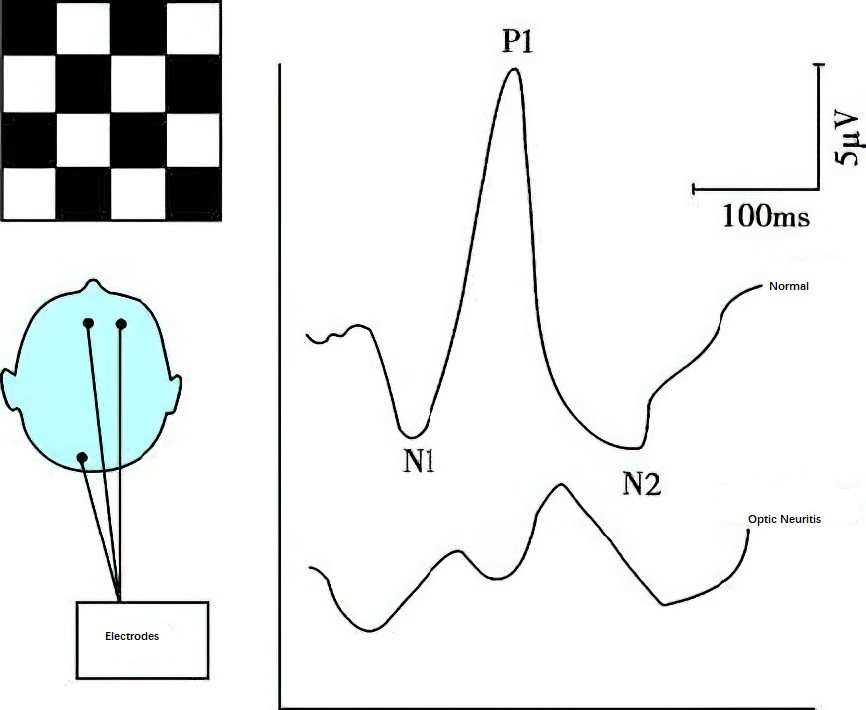
Figure 2 Visual evoked potential
VEP tests include flash VEP and pattern VEP, depending on the stimulus type.
- Flash VEP is suitable for individuals with severely reduced vision who are unable to undergo pattern VEP. It requires less cooperation but shows greater variability in amplitude and latency.
- Pattern VEP uses a reversing checkerboard pattern as the stimulus, producing stable and reproducible waveforms.
- Flash VEP typically includes N1, P1, and N2 waves, while pattern VEP includes N75, P100, and N145 waves, with P100 being the most prominent and consistent marker. Its latency demonstrates minimal variation across and within individuals, making it a reliable clinical diagnostic parameter.
Clinical applications include:
- Diagnosis of optic nerve and visual pathway disorders: Most commonly characterized by a prolonged P100 latency and reduced amplitude. In demyelinating optic neuritis, P100 amplitude may remain normal with significant latency prolongation.
- Differentiation of functional versus organic vision loss: Normal VEP in cases of subjective visual complaints indicates non-organic causes.
- Monitoring amblyopia treatment outcomes, as shown by prolonged latency and reduced amplitude of P100 in amblyopic eyes.
- Assessment of visual function in infants or non-verbal children.
- Prediction of postoperative visual function in patients with opaque ocular media.
Electrooculogram (EOG)
The EOG records resting potential changes in the eye without requiring additional light stimuli. It originates from the retinal pigment epithelium and is abnormal in conditions affecting the retinal pigment epithelium or photoreceptor cells, as well as in toxic retinal diseases. Typically, EOG findings correlate with ERG results. It is particularly useful in children who cannot tolerate contact lens electrodes used in ERG testing.