Visual acuity measured by a standard eye chart reflects the macula's ability to resolve small targets with high contrast (a pronounced black-and-white difference) at high spatial frequencies. However, it does not provide a comprehensive assessment of the sensitivity to form perception. The human ability to perceive external objects also involves distinguishing differences in brightness (contrast) between various lines or patterns and their backgrounds. Spatial frequency refers to the number of cycles of brightness modulation (light and dark) per degree of visual angle in an image or stimulus pattern. It is expressed in cycles per degree (c/d). Contrast sensitivity refers to the ability of the human eye to recognize sinusoidal grating patterns of different spatial frequencies under conditions of variable brightness contrast. The lowest contrast that the human eye can detect is called the contrast sensitivity threshold; the lower the threshold, the higher the sensitivity.
By using spatial frequency as the horizontal axis and contrast (the difference in brightness between the grating and its background) as the vertical axis, a contrast sensitivity function (CSF) curve can be established. This curve combines visual angle and contrast to measure the ability of the human eye to perceive patterns at various spatial frequencies, providing a more comprehensive understanding of form perception. In individuals with normal vision, the curve typically has an inverted "U" shape. It offers more information than conventional eye charts, with the low-frequency range reflecting visual contrast, the mid-frequency range representing a combination of contrast sensitivity and central visual acuity, and the high-frequency range indicating visual resolution. Therefore, contrast sensitivity testing is useful for the early detection and monitoring of certain vision-related eye diseases. For instance, early cortical cataracts affect low-frequency contrast sensitivity; early nuclear cataracts impact high-frequency contrast sensitivity, while more mature cataracts affect contrast sensitivity at both high and low frequencies.
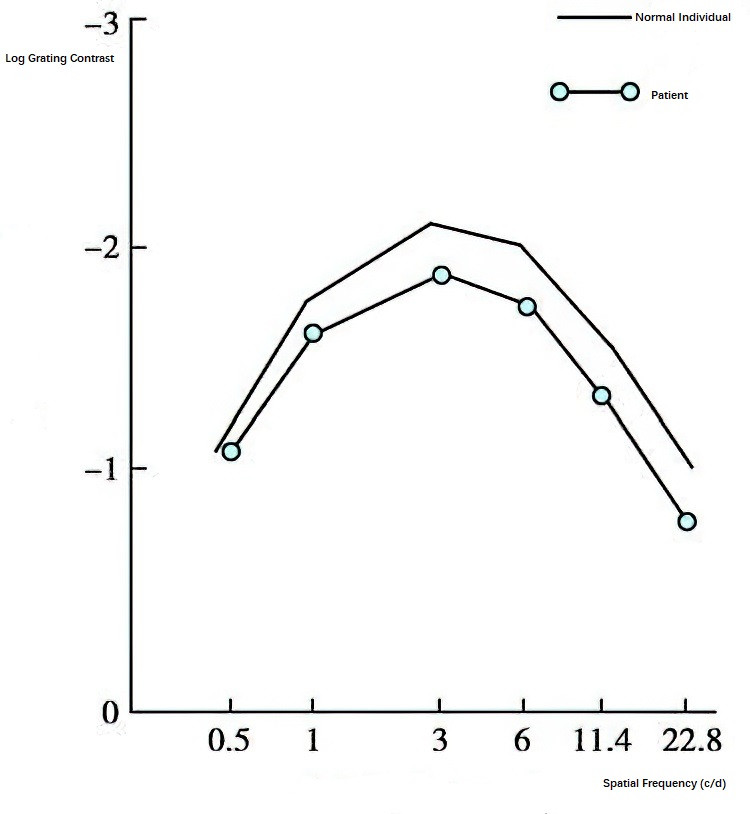
Figure 1 Contrast sensitivity function curve of a person with normal vision compared to a patient
Contrast sensitivity testing initially relied on the Arden grating chart (introduced in 1978), which is simple and suitable for mass screening but is limited to measuring up to only 6 c/d and lacks accuracy. Nowadays, contrast sensitivity is often assessed using the Functional Acuity Contrast Test (FACT) chart or computer-based systems, such as the Takaci-CGT-1000 automated glare contrast sensitivity testing instrument.
In recent years, laser-based contrast sensitivity measuring devices have been introduced. These systems project laser interference patterns directly onto the retina, utilizing helium-neon lasers. By taking advantage of the coherence of laser light, two beams of helium-neon laser light are passed through a specific setup to create a point light source that focuses on the nodal point of the eye. The laser beams pass through the ocular media to form alternating red and black interference stripes on the retina. By altering the stripe spacing of the interference pattern and the brightness of the background light, the contrast sensitivity threshold at different spatial frequencies (also referred to as "laser visual acuity") can be recorded.